
T2* mapping is a magnetic resonance imaging technique used to calculate the T2* time of tissue and display them voxel-vice on a parametric map. It is used for myocardial tissue characterisation 1-4 and has been investigated for other tissues 5,6.
On this page:
Clinical applications
T2* relaxation time has become useful in the evaluation of myocardial iron content and assessment of myocardial haemorrhage, specifically for the following indications 1-3:
-
myocardial iron overload
ß-thalassaemia
-
assessment of chelation therapy
therapy decision and monitoring 4
Patients with transfusion-dependent anaemia or haemochromatosis showing T2* values <20 ms are at risk for arrhythmia and systolic dysfunction and with T2* levels <10 are at high risk for heart failure 2,7. In the setting of acute myocardial infarction, T2*-mapping values <20 ms indicate microvascular injury 8.
Technique
T2* mapping is usually based on gradient echo (GRE) sequences.
Physical principles
T2* [ms] results principally from variations in the static magnetic field throughout the tissue which will be added to random mechanisms. Thus, T2* is a time constant for the decay of transverse magnetisation, but in the presence of local magnetic field inhomogeneities, it is shorter than T2 [ms] alone 1-4.
Image acquisition
T2* mapping acquisition has been recommended on a 1.5 Tesla MR scanner with a multi-gradient echo technique typically with 8 equally spaced echoes ranging from 2 ms to 18 ms 1-3.
A black-blood sequence has been recommended because of better image quality, and intra- and interobserver reproducibility 3.
Like T2 values, T2* can be calculated pixel-wise from a signal intensity versus time curve fitting model 2,3. The motion between the images needs to be corrected.
Interpretation
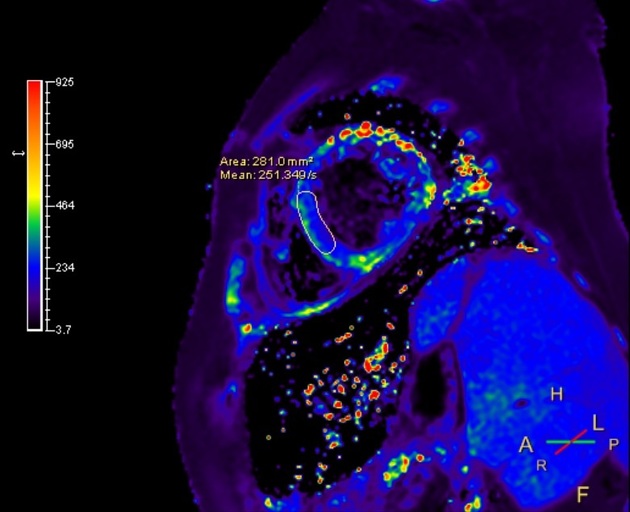
It has been recommended to assess T2* for iron overload in the interventricular septum 1-3.
A 3-tier risk model (low, intermediate and high risk) has been recommended 1-3:
-
T2* >20 ms or R2* <50 Hz
no iron overload
-
T2* 10-20 ms or R2* 50-100 Hz
mild to moderate iron overload
-
T2* <10 ms or R2* >100 Hz
severe iron overload
Pitfalls and artifacts
The large cardiac veins can induce artifacts due to susceptibility differences between the deoxygenated blood in the veins and the adjacent myocardium 2. This is less of a problem in black-blood sequences 2. Epicardial fat at the anterior wall and the heart-lung interface mostly apparent at the free lateral wall are other sources of artifacts 2.


 Unable to process the form. Check for errors and try again.