
The technique of magnetic resonance spectroscopy (usually shortened to MR spectroscopy or MRS) allows tissue to be interrogated for the presence and concentration of various metabolites. Grossman and Yousem said "If you need this to help you, go back to page 1; everything except Canavan (disease) has low NAA, high choline" 1. This is perhaps a little harsh, however, it is fair to say that MRS often does not add a great deal to an overall MR study but does increase specificity, and may help in improving our ability to predict histological grade.
On this page:
Physics
The basic principle that enables MR spectroscopy (MRS) is that the distribution of electrons within an atom cause nuclei in different molecules to experience a slightly different magnetic field. This results in slightly different resonant frequencies, which in turn return a slightly different signal. The technique is identical to that of nuclear magnetic resonance (NMR) as used in analytical chemistry, but the community commonly refers to in vivo NMR as MRS to avoid confusion (and, arguably, the word "nuclear").
MR spectra can be acquired from any "NMR-active" nucleus, which is a nucleus possessing non-zero spin: protons, carbon-13 and phosphorus-31 are the most commonly encountered, and in clinical practice essentially only proton spectra (which enable the resolution of metabolite profiles in vivo) are encountered. Phosphorus-31 (P-31) is typically used to look at the ratio of adenosine triphosphate (ATP) to phosphocreatine and other metabolites, and can be used to assess the energy charge of the cell.
If raw signal was processed then the spectra would be dominated by water, which would make all other spectra invisible. Water suppression is therefore part of any MRS sequence, either via inversion recovery or chemical shift selective (CHESS) techniques. If water suppression is not successful then a general slope to the baseline can be demonstrated, changing the relative heights of peaks.
Magnetic resonance spectroscopy (MRS) is performed with a variety of pulse sequences. The simplest sequence consists of a 90 degree radiofrequency (RF) pulse, without any gradients, with reception of the signal by the RF coil immediately after the single RF pulse.
Many sequences used for imaging can be used for spectroscopy also (such as the spin echo sequence). The important difference between an imaging sequence and a spectroscopy sequence is that for spectroscopy, a read-out gradient is not used during the time the RF coil is receiving the signal from the person or object being examined. Instead of using the frequency information (provided by the read-out or frequency gradient) to provide spatial or positional information, the frequency information is used to identify different chemical compounds. This is possible because the electron cloud surrounding different chemical compounds shields the resonant atoms of spectroscopic interest to varying degrees depending on the specific compound and the specific position in the compound. This electron shielding causes the observed resonance frequency of the atoms to slightly different and therefore identifiable with MRS.
Peaks
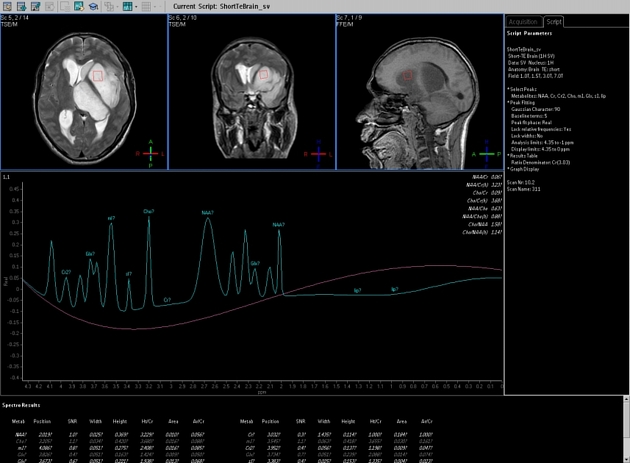
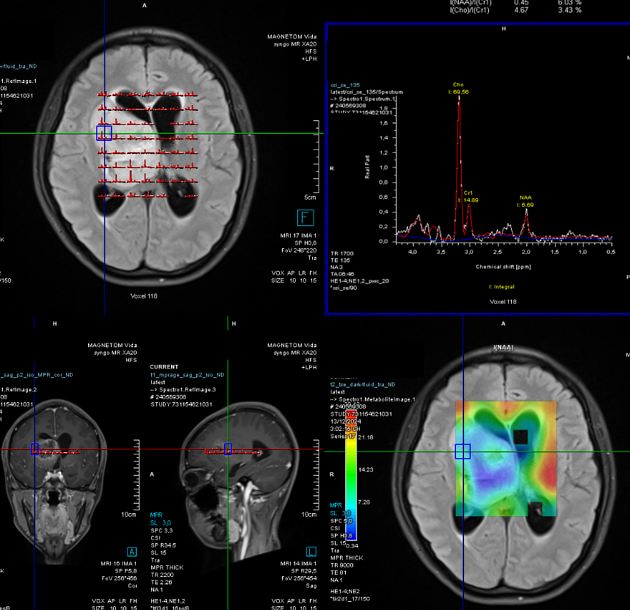
Many thousands of metabolite peaks have been described, although most are not identifiable using routine imaging techniques and it is the Time of Echo (TE) that conditions the number of measurable metabolites: long TE (136-272 ms) vs short TE (10-50 ms) 7-8.
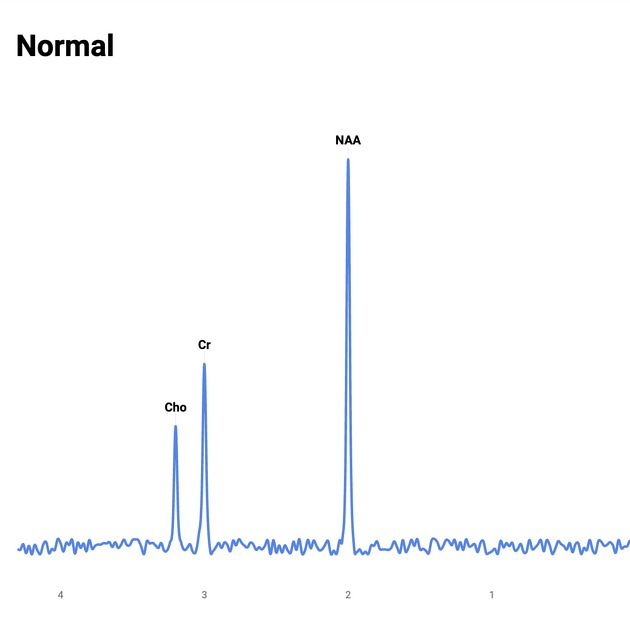
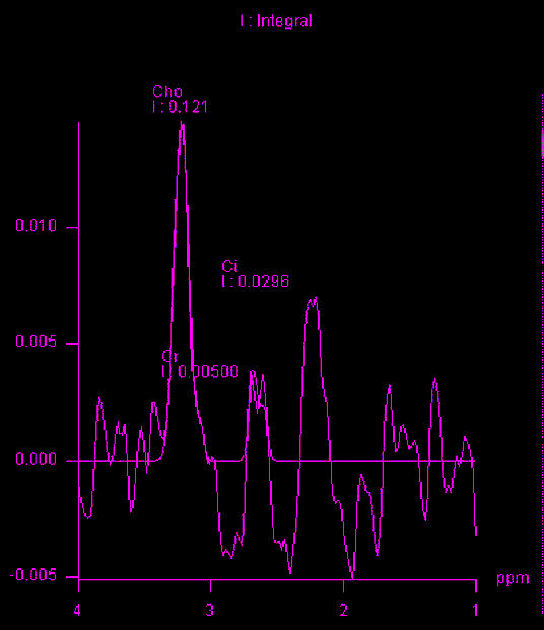
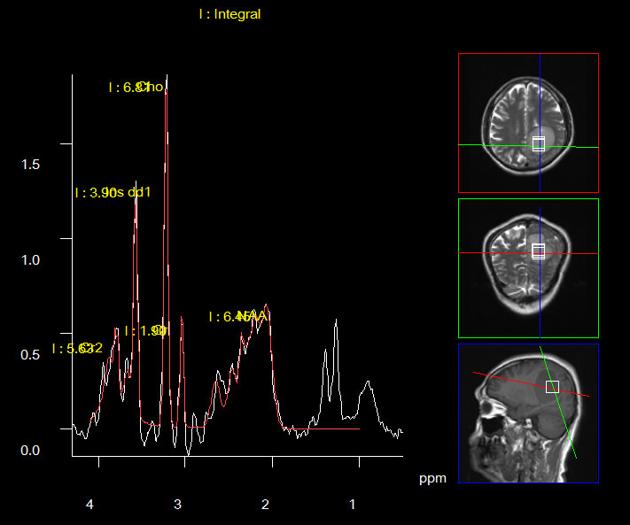
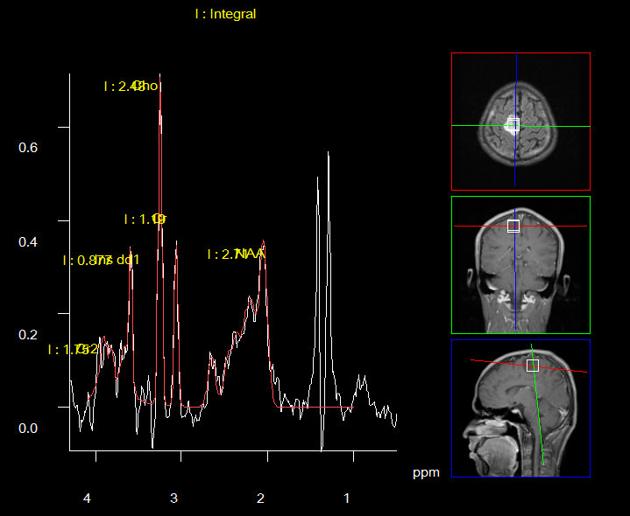
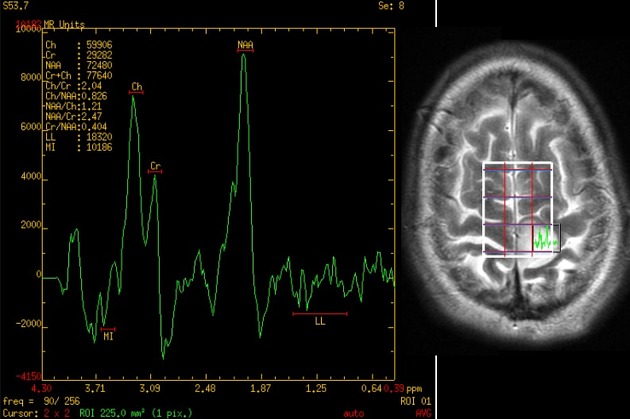
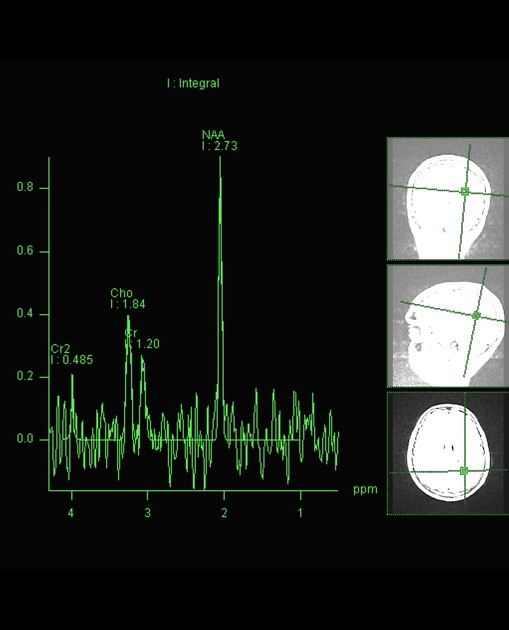
Peaks are plotted from right to left along the x-axis and the y-axis (height) is the degree of chemical shift as expressed in part-per-million (ppm). The reason for ppm to be used rather than a shift of frequency in hertz (Hz) is so that spectra can be compared independent of magnet field strength 11-12. Normal choline, creatine, and NAA peaks form a straight line that if extended, create an angle of 45 degrees with the x-axis. This is known as Hunter's angle and can be used to determine quickly whether the MRS is most probably normal or not.
Choline usually comes from some choline containing compounds that are important in membrane synthesis and degradation. Thus, brain tumours usually show high choline peak due to increased membrane turnover. NAA comes from normal neuronal or axonal tissue. In brain tumours, there is a loss of neuronal tissue, thus leading to reduced NAA peak 13.
lipids: resonates at 1.3 ppm
lactate: resonates at 1.33 ppm
alanine: resonates at 1.48 ppm
N-acetylaspartate (NAA): resonates at 2.0 ppm
glutamine/glutamate: resonates at 2.2-2.4 ppm
GABA: resonates at 2.2-2.4 ppm
2-hydroxyglutarate: resonates at 2.25 ppm 6
citrate: resonates 2.6 ppm
creatine: resonates at 3.0 ppm
choline: resonates at 3.2 ppm
myo-inositol: resonates at 3.5 ppm and. 4.06 ppm
water resonates at 4.7 ppm
Less common peaks
propylene glycol: resonates at 1.14 ppm
ethanol: resonates at 1.16 ppm
acetate: resonates at 1.9 ppm
acetone: resonates at 2.22 ppm
acetoacetate: resonates at 2.29 ppm
succinate: resonates at 2.4 ppm
methylsulfonylmethane: resonates at 3.15 ppm
scyllo-inositol: resonates at 3.36 ppm
taurine: resonates at 3.4 ppm
glucose: resonates at 3.43 ppm and 3.8 ppm
mannitol: resonates at 3.78 ppm
creatine (second peak): resonates at 3.95 ppm 10
lactate quartet: resonates at 4.11 ppm
NB: ppm = parts per million
Related pathology
Glioma
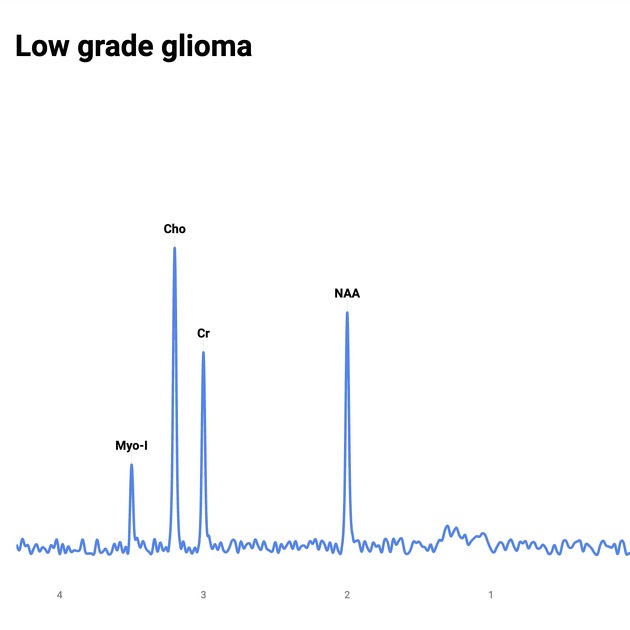
MRS can help increase our ability to predict grade. As the grade increases, NAA and creatine decrease and choline, lipids and lactate increase.
In the setting of gliomas, choline will be elevated beyond the margins of contrast enhancement in keeping with cellular infiltration.
Non-glial tumours
May be difficult but in general non-glial tumours will have little, if any, NAA peak.
Radiation effects
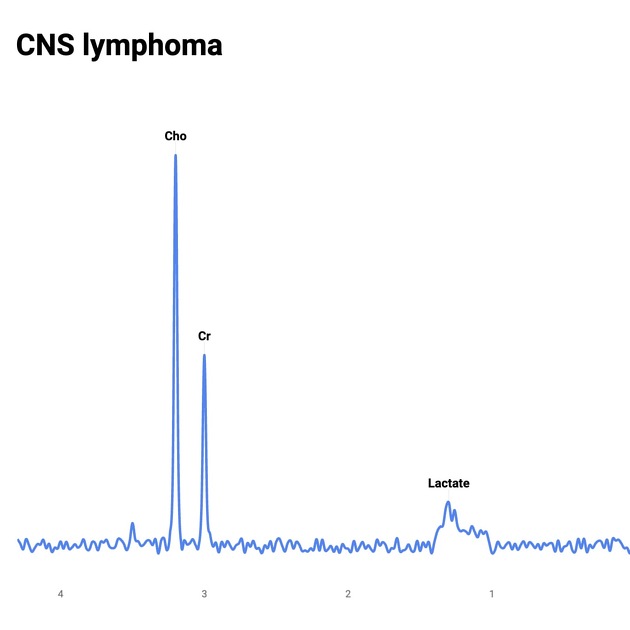
Distinguishing radiation change and tumour recurrence can be problematic. In recurrent tumour choline will be elevated, whereas in radiation change, NAA, choline and creatine will all be low.
Ischaemia and infarction
Lactate will increase as the brain switches to anaerobic metabolism. When infarction takes place then lipids are released and peaks appear.
Infection
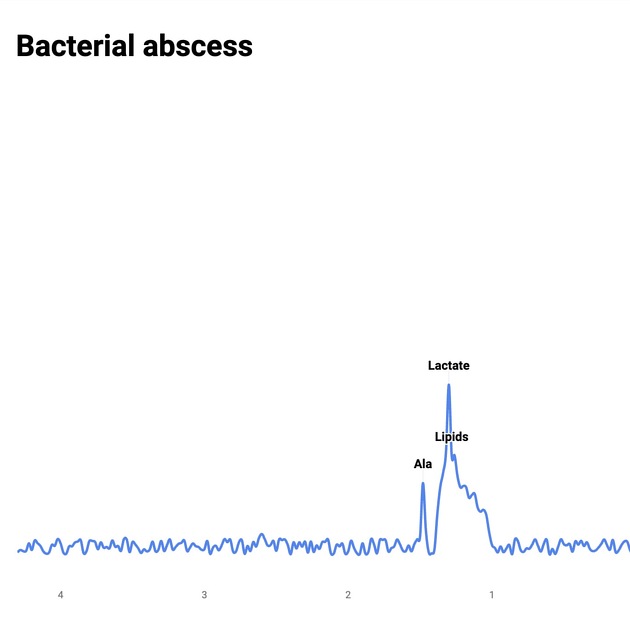
As in all processes which destroy normal brain tissue, NAA is absent. Within bacterial abscess cavities, lactate, alanine, cytosolic acid and acetate are elevated/present.
Of note choline is low or absent in toxoplasmosis, whereas it is elevated in lymphoma, helping to distinguish the two.
White matter diseases
progressive multifocal leukoencephalopathy (PML) may demonstrate elevated myo-inositol
Canavan disease characteristically demonstrates elevated NAA
Hepatic encephalopathy
Markedly reduced myo-inositol, and to a lesser degree choline. Glutamine is increased.
Mitochondrial disorders
Leigh syndrome: elevated choline, reduced NAA and occasionally elevated lactate
Meningioma
May show an alanine peak 14.
Mnemonic
My ChoCrNaaLa (think of a new chocolate energy bar or something)
My: Myo-inositol 3.5
Cho: Choline 3.2
Cr: Creatine 3.0
Naa: Naa 2.0
L: Lactate 1.3
History and etymology
MRS of intact biological tissues was first reported by two groups: Moon and Richards using P-31 MRS to examine intact red blood cells in 1973, and Hoult et al. using P-31 MRS to examine excised leg muscle from the rat in 1974. The first MR spectrum of a human brain in vivo was published in 1985 by Paul A Bottomley 9.


 Unable to process the form. Check for errors and try again.
![F-18 2-(1-{6-[(2-[fluorine-18]fluoroethyl)(methyl)amino]-2-naphthyl}-ethylidene)malononitrile](/articles/fddnp-f-18?embed_domain=hackmd.io%25252525252525252F%252525252525252540yIPUAFeCSL2JsU8smR5nJQ%25252525252525252Fbnjhjgjghjghjghfavicon.icoradiopaedia-icon-144.pngfavicon.icoradiopaedia-icon-144.png&lang=gb)