
Patient Data
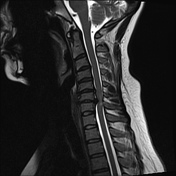

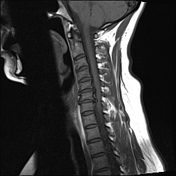

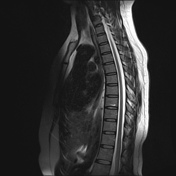
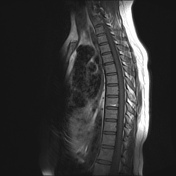
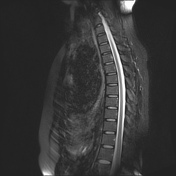
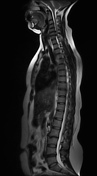

Cervical spine has lost the normal physiological lordosis and has a straight vertebral body alignment. There is loss of cervical disc sign on T2 inferring dehydration. C5/6: Moderate right paramedian disc protrusion indents the spinal cord anteriorly, with normal cord signal maintained. Mild stenosis of the right intervertebral foramen. C6/7: Moderate central disc protrusion indents the spinal cord anteriorly, especially with a left paramedian disc extrusion component, associated with high cord signal on T2. Mild stenosis of the intervertebral foramina.

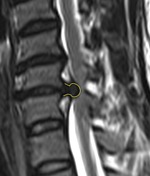
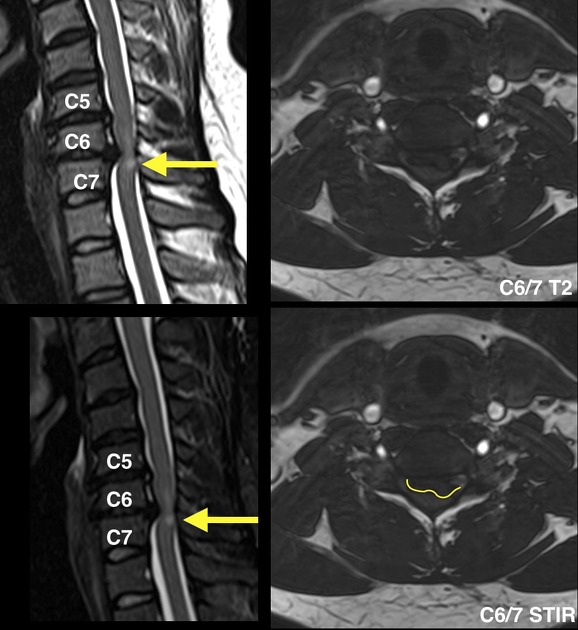
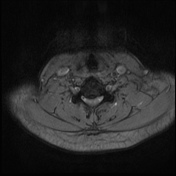
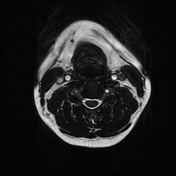
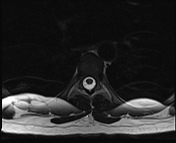
Yellow arrow showing the spinal cord myelopathy characterized by increased signal on T2/STIR at the level of C6/7 disc (sagittal images on the left). Axial images on T2 and STIR demonstrate disc protrusion with an extrusion component at C6/7 level. Left parasagittal image delineating the extrusion component.
Case Discussion
Cervical cord compressive myelopathy is caused by narrowing of the sagittal diameter of the spinal canal secondary to congenital, degenerative or traumatic changes in the cervical spine.


 Unable to process the form. Check for errors and try again.