
Presentation
Patient with long history of oral contraceptive use presented for an ultrasound due to an elevated alkaline phosphatase level (US not shown). No other symptoms. This ultrasound revealed a liver lesion and CT was ordered for further characterisation.
Patient Data


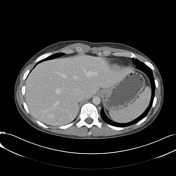

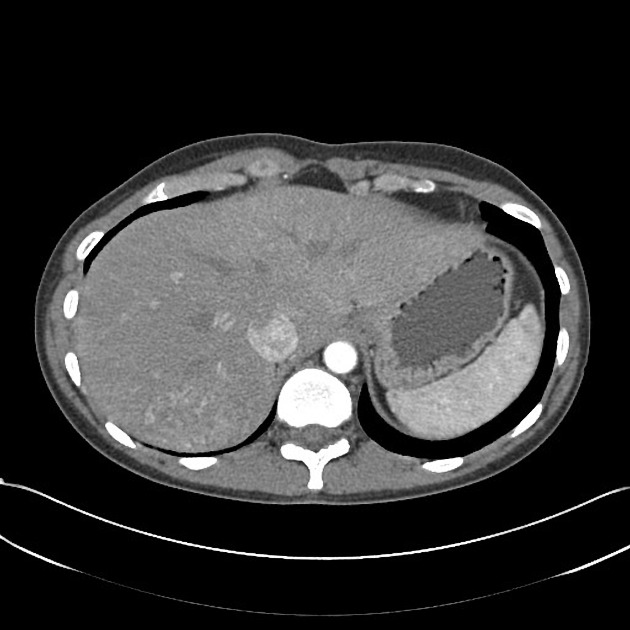
There are no morphologic changes to suggest cirrhosis.
There are five hepatic lesions, three of which are best visualised on arterial phase imaging. All of these lesions demonstrate variable arterial enhancement.
The largest mass is in the subcapsular posterior segment of the right hepatic lobe (segment 7), measuring 3.6 x 5.6 x 4.4 cm. It shows heterogeneous diffuse patchy internal enhancement on the arterial phase with variable persistent enhancement on venous phase and is not discretely visualised on the delayed phase. The enhancement characteristics are not specific.
(The other lesions were thought to be a mix of classic and flash-filling haemangiomas)
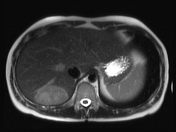

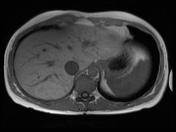
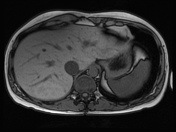
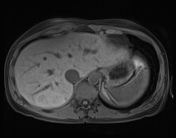
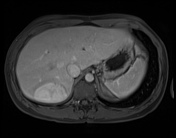
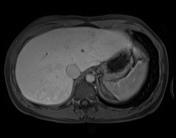
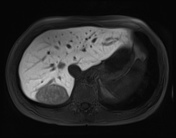
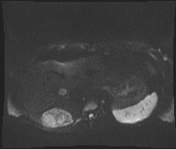

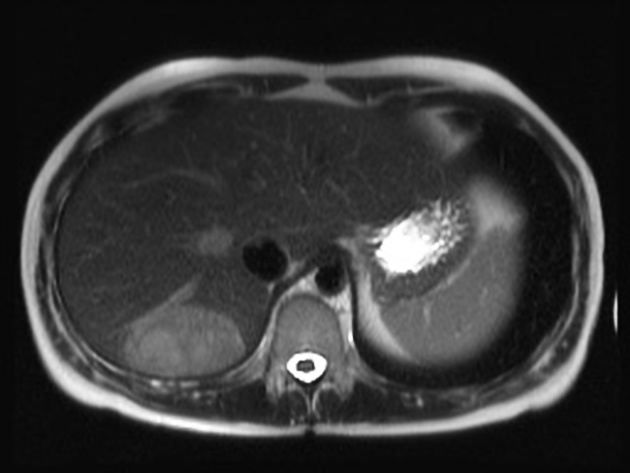
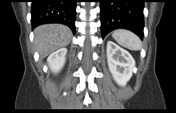
The liver is normal in size and configuration with multiple hepatic lesions again seen.
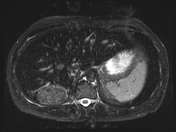
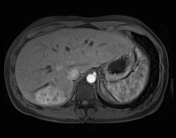
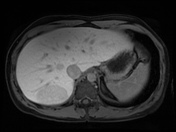
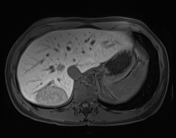
In the right posterior hepatic lobe there is a mass measuring 3.6 x 5.8 x 4.8 cm. It shows heterogeneous predominantly high T2 and intermediate T1 signal intensity as compared to the liver. It demonstrates focal regions of increased T1 signal intensity in the precontrast sequences, which may represent haemorrhagic foci. It also shows restricted diffusion with heterogeneous early arterial enhancement which remains hyperintense to liver parenchyma on portal venous sequences, and becomes heterogeneously hypointense to liver parenchyma on delayed and hepatobiliary sequences. Favour an inflammatory type hepatic adenoma.
(Three of the other lesions were found to be additional adenomas. One of them was a haemangioma.)
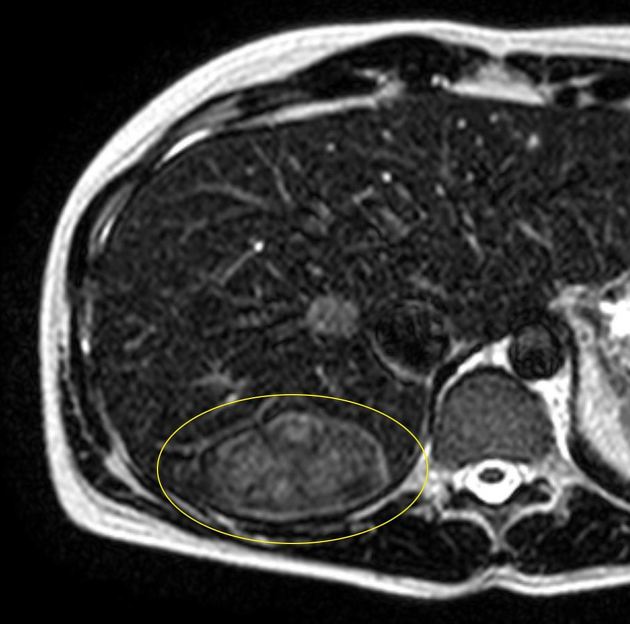
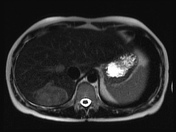
The yellow oval is around the thin T2 hyperintense border of this mass - a finding that has been associated with inflammatory hepatic adenoma subtype and termed the "atoll sign."
Case Discussion
The "atoll sign" - a rim of T2 hyperintensity around a liver mass that otherwise shows characteristics compatible with a hepatic adenoma - is associated with the inflammatory adenoma subtype.
After confident diagnosis that this was a hepatic adenoma as opposed to a malignancy it was effectively bland embolised due to its size and the risk of haemorrhage. It has shown no recurrence over the course of many years.


 Unable to process the form. Check for errors and try again.