
Presentation
Chest pain elevated troponin T: 1.4 µg/L, CK 19.2 µmol/L, LDH 6.3 µmol/L and C-reactive protein (CRP): 17 mg/L. Mildly decreased cardiac function on echo. Coronary artery disease and anomalies ruled out by CTA.
Patient Data


Heart rate: 65 bpm, haematocrit: 0.42
Image quality: mild respiratory artifacts, otherwise no limitations
Morphology and functional analysis (endo-volume):
LV-EDVI: 90 mL/m²
LV-ESVI: 43 mL/m²
LV-SVI: 46 mL/m²
LV-EF: 52%
cardiac output: 5.7 L/min
cardiac index: 3.0 L/min/m²
LV-ED wall + papillary mass: 77 g
septum thickness: 8 mm
Findings:
No regional left ventricular wall motion abnormalities.
Visually normal atrial size.
No significant cardiac valve pathology.
No intracavitary thrombi.
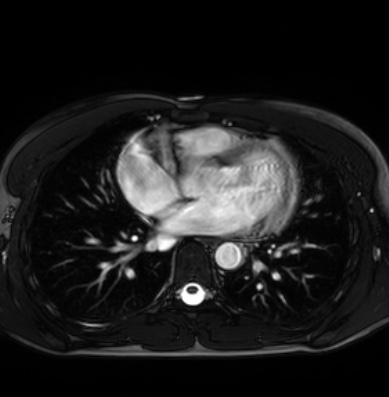
Small bilateral pleural effusions.
Minimal pericardial enhancement without thickening, adjacent to the left ventricular free wall.
No pericardial effusion.
Myocardial tissue properties (according to Lake Louise criteria II) 1:
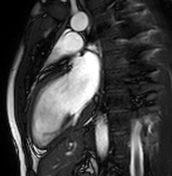
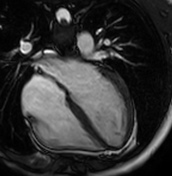
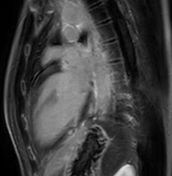
Regional myocardial oedema is visible in the lateral wall from anterolateral to inferior and basal to apical.
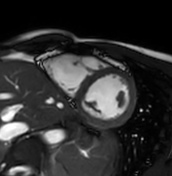
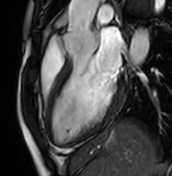
Patchy subepicardial late gadolinium enhancement (LGE) visible in the lateral and inferior segments from basal to apical.
T1 mapping: >1100 ms* (z-score: ~3-4)
extracellular volume (ECV): 34-40% in lateral and inferior segments
T2 mapping: 65-70 ms* (z-score: ~5-7)
*Normal reference ranges based on local data:
native T1: 940-1060 ms; ECV: <32%; T2: 44-56 ms
Impression:
Cardiac MRI findings are consistent with acute inflammatory changes of the whole lateral wall of the myocardium or acute myocarditis.

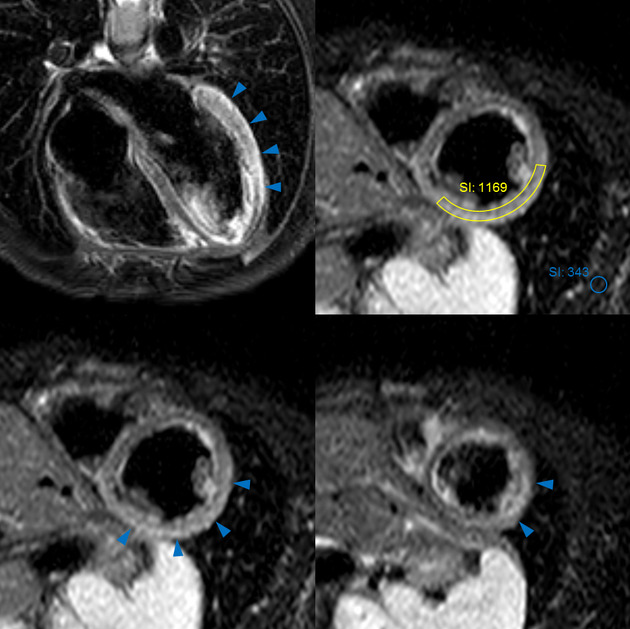
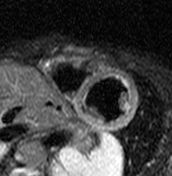
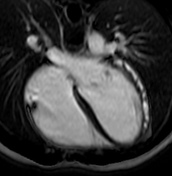
T2 black-blood/STIR
Focal myocardial oedema can be seen in the lateral and inferior segments from basal to apical (blue arrowheads).
Myocardial oedema can also be assessed by calculating the T2 signal intensity ratio between the myocardium and skeletal muscle within the same image.
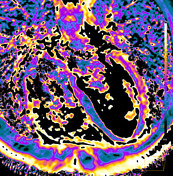
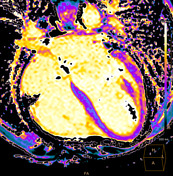
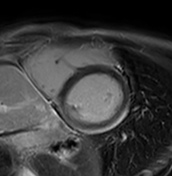
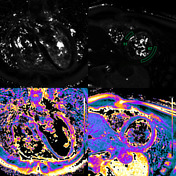
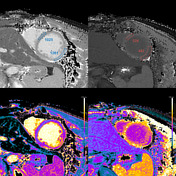
T1 mapping
Increased native T1 in the basal, midventricular, apical lateral, and inferior segments is measured and displayed on a colour map T1 >1150 ms (z-score of >5 based on local data).
The T1 values in the septum are within the normal limits of the local reference range.
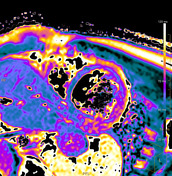
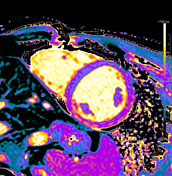
T2 mapping
Increased T2 values are measured in the basal, midventricular, apical lateral, and inferior walls as another proof of myocardial oedema in those segments.
The T2 values in the septum are within the normal limits of the local reference range.
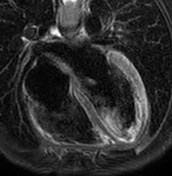
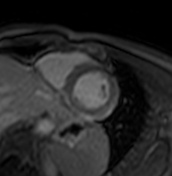
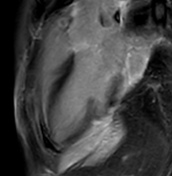
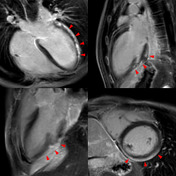
Late gadolinium enhancement (LGE)
Patchy intramyocardial and focal subepicardial late gadolinium enhancement can be seen on IR-GE images (red arrowheads), which is a characteristic pattern in myocarditis and reflects myocardial injury or myocardial necrosis but is neither very sensitive nor specific if used exclusively 2.
Case Discussion
This case is an example of myocardial tissue characterisation in a patient with typical features of myocarditis.
According to the Lake Louise criteria, both main criteria are fulfilled 2:
myocardial oedema (based on T2W images or T2 mapping)
non-ischaemic myocardial injury (abnormal native T1, ECV, or LGE)
In addition, there is mild systolic dysfunction present, which further supports the diagnosis and accounts for one of the supportive criteria (pericarditis, systolic dysfunction).


 Unable to process the form. Check for errors and try again.