Presentation
Acute paraparesis.
Patient Data
![](https://prod-images-static.radiopaedia.org/images/2395389/1e7abf5fff196263cbf204f139f451083ec6f8b396e95c4cd789daa5020ef73b_thumb.jpeg)
![This study is a stack](/packs/stack-YQKLCKBI.gif)
![](https://prod-images-static.radiopaedia.org/images/2395397/01286766a37dcff9aaf26544f6b6d1e307a669b11ecea9b14365df4d585923ee_thumb.jpeg)
![This study is a stack](/packs/stack-YQKLCKBI.gif)
![](https://prod-images-static.radiopaedia.org/images/2395430/696ddf302e205b61df6be10e558fa3b614596e9aa6490aef778446478f621143_thumb.jpeg)
![This study is a stack](/packs/stack-YQKLCKBI.gif)
![](https://prod-images-static.radiopaedia.org/images/2395423/f090c05f1206a9482c4a42be2a6b45aa70f9cd8759b2ec18dcc554540ad4a6d7_thumb.jpeg)
![This study is a stack](/packs/stack-YQKLCKBI.gif)
![](https://prod-images-static.radiopaedia.org/images/2395429/c1d3f03a2bd5c0672ba982d2e2181149fb95e66e8079978074cbcab450d20390_thumb.jpeg)
![This study is a stack](/packs/stack-YQKLCKBI.gif)
![](https://prod-images-static.radiopaedia.org/images/2395433/d70fa44337a2c7680b46fc742e6cb0a5ea492ec5c218bc73bb1e0667c4b5ee47_thumb.jpeg)
![This study is a stack](/packs/stack-YQKLCKBI.gif)
![](https://prod-images-static.radiopaedia.org/images/2395623/6026850d83b809987b810cca39b5d354662c70decf95c5b1ae8863ecab5e4f37_thumb.jpeg)
![This study is a stack](/packs/stack-YQKLCKBI.gif)
![](https://prod-images-static.radiopaedia.org/images/2395642/b95462f4feaad4043d8e0fac68b79398c9eb895c7287b911568d712a1e0c10fe_thumb.jpeg)
![This study is a stack](/packs/stack-YQKLCKBI.gif)
![](https://prod-images-static.radiopaedia.org/images/2395583/60ad835ef564f37d5e49c924258d108597f9dd13ede2679b3d3427ab7f2ef216_thumb.jpeg)
![This study is a stack](/packs/stack-YQKLCKBI.gif)
![](https://prod-images-static.radiopaedia.org/images/2395738/9f2a1420a698e5151f8d98011f8e8cf2c03874ea77b738ea43f390ddab54c3ea_thumb.jpeg)
![This study is a stack](/packs/stack-YQKLCKBI.gif)
![](https://prod-images-static.radiopaedia.org/images/2395713/1723653c3ec62763c18b92f6cf0de040b4eab7c7d59b80afd0872682b271d7ca_thumb.jpeg)
![This study is a stack](/packs/stack-YQKLCKBI.gif)
![](https://prod-images-static.radiopaedia.org/images/2395730/259384bc7e152739224eb51c437eddcd4852c7bf78cb413b5a341af18875ad61_thumb.jpeg)
![This study is a stack](/packs/stack-YQKLCKBI.gif)
![](https://prod-images-static.radiopaedia.org/images/2395389/1e7abf5fff196263cbf204f139f451083ec6f8b396e95c4cd789daa5020ef73b_big_gallery.jpeg)
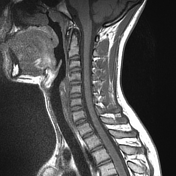
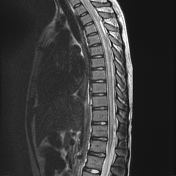
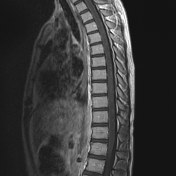
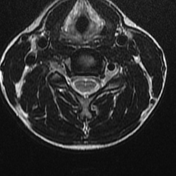
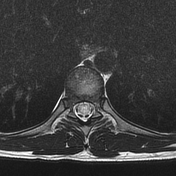
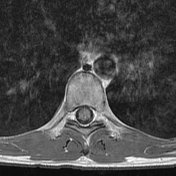
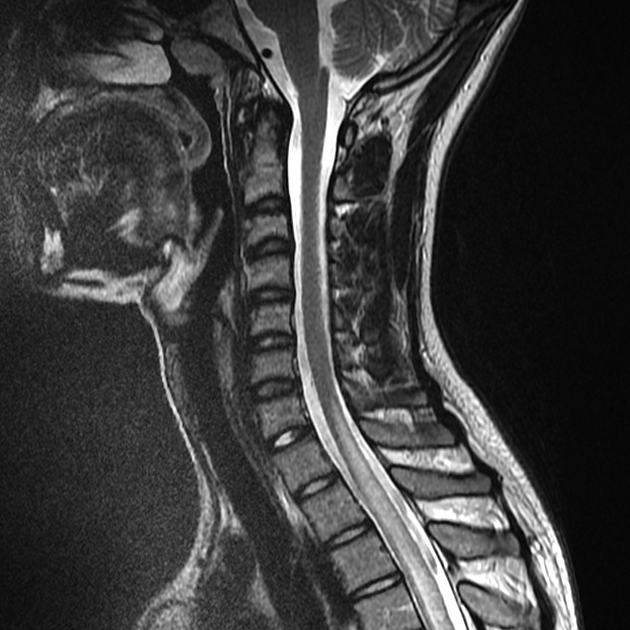
Extensive increased T2 signal and expansion of the cord (longitudinally extensive spinal cord lesion) is seen extending between C7 and T12. The T2 signal abnormality involves central grey matter and dorsal columns. Linear sagittally oriented enhancement is seen posteriorly within the cord in the mid and lower thoracic cord.
![](https://prod-images-static.radiopaedia.org/images/2397310/6a81de00fd9fdcadb8832ea5e5298da7626a086d678f5787ec4060b6ac1b5db0_thumb.jpeg)
![This study is a stack](/packs/stack-YQKLCKBI.gif)
![](https://prod-images-static.radiopaedia.org/images/2397127/5aa29dd97b180ed1ab160b015784a266a3cb4f62ae1e7872b9eb9d119fdc1656_thumb.jpeg)
![This study is a stack](/packs/stack-YQKLCKBI.gif)
![](https://prod-images-static.radiopaedia.org/images/2397300/5a39bfb385c087b8f2bc76900ac3a4bb3ebbf970591bb245f4f559ac88556b20_thumb.jpeg)
![This study is a stack](/packs/stack-YQKLCKBI.gif)
![](https://prod-images-static.radiopaedia.org/images/2397203/fa6456f62acaef3395da8b387abf5ef43ccb09e7997363f14d0b563f40af574e_thumb.jpeg)
![This study is a stack](/packs/stack-YQKLCKBI.gif)
![](https://prod-images-static.radiopaedia.org/images/2397243/1d2570cdbadd1eac3501ced6ec7f2be9adb404845c09e1d6a13cd1275d8b69ed_thumb.jpeg)
![This study is a stack](/packs/stack-YQKLCKBI.gif)
![](https://prod-images-static.radiopaedia.org/images/2397251/ef0aa784c8f75fa38645d408f1dd38f947c930e10fe142fd46066564bbe873ea_thumb.jpeg)
![This study is a stack](/packs/stack-YQKLCKBI.gif)
![](https://prod-images-static.radiopaedia.org/images/2397310/6a81de00fd9fdcadb8832ea5e5298da7626a086d678f5787ec4060b6ac1b5db0_big_gallery.jpeg)
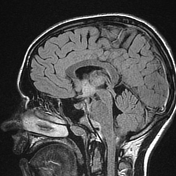
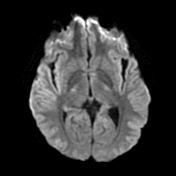
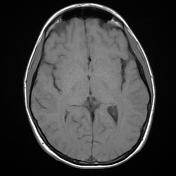
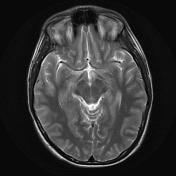
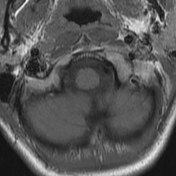
The left hypothalamus, mammillary body, and immediately adjacent portion of the optic chiasm and optic tract are of abnormally high signal intensity. No restricted diffusion or abnormal contrast enhancement. Cerebral parenchymal signal intensity and architecture are otherwise normal. Ventricles and sulci are normal for the patient's age. Normal flow voids are seen from the major arteries at the base of the brain.
Case Discussion
CSF demonstrated a lymphocytosis and NMO antibodies were positive confirming the diagnosis of neuromyelitis optica spectrum disorder.
Treatment was commenced including azathiaprine, intragram and prednisolone with gradual recovery of function.
A repeat MRI 4 months later (not shown) demonstrated complete resolution of changes with a normal spinal cord.