
Presentation
Day 2 post pituitary fossa surgery. Gas in the pituitary fossa?
Patient Data


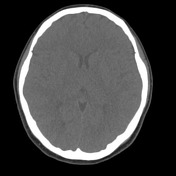

The sella turcica is enlarged.
High attenuation material in the sella in keeping with post-operative blood.
Centrally in the pituitary fossa is a focus of low attenuation consistent with fat.
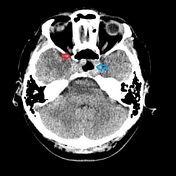
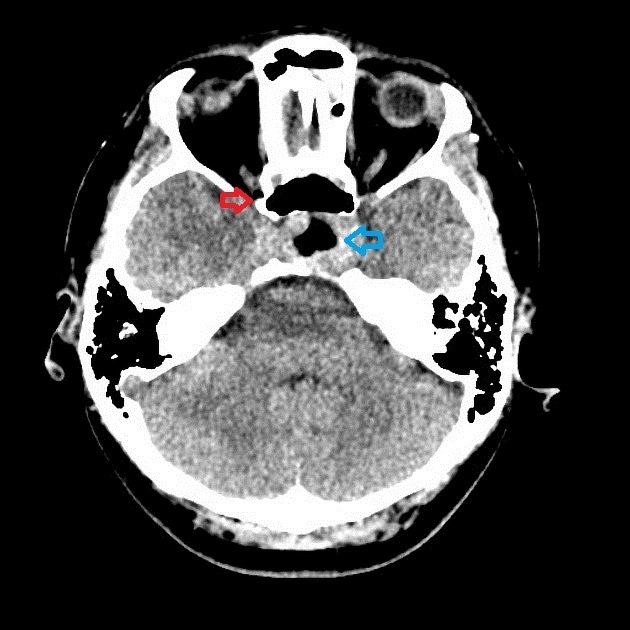
On the standard brain windows the low attenuation in the pituitary fossa (blue arrow) has to the naked eye an identical appearance to that of air in the adjacent sphenoid sinus.
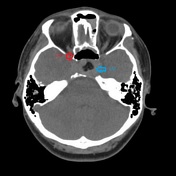
On manual windowing (close to soft tissue settings) one can appreciate this isn't air, but in fact fat (the HU units were consistent with this).
Case Discussion
Use all the tools at your disposal in CT for assessment. Yes, it takes more time and effort to view in multiple windows but it can be important.
Use manual windowing too not just pre-sets, as they don't cover everything.
This example and manual windowing for small subdurals are prime examples.


 Unable to process the form. Check for errors and try again.