
Presentation
Three months history of progressive weakness of the lower limbs
Patient Data


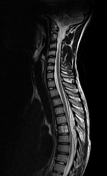

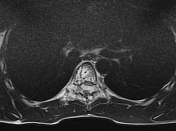
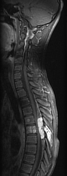
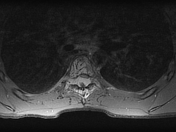
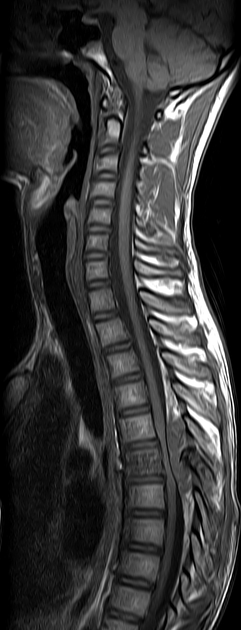
The vertebral body, as well as the posterior elements of T6, show an abnormal signal intensity of the bone marrow which appears hypointense on T1WI, hyperintense on T2WI with vertical striations of low signal on both TWI and T2WI within a background of high signal corresponding to a "corduroy sign" on sagittal T1WI and T2WI and "polka-dot sign" on same axial sequences. The post-contrast sequences show an intense and heterogeneous enhancement.
There is an associated posterior epidural lentiform shaped mass of low signal intensity on T1WI, high signal with intense and relatively homogeneous enhancement on post-contrast sequences. The adjacent segment of the spinal cord is compressed and displaced anteriorly with intramedullary T2 hyperintensity from T5 to T7 level, indicating a compressive myelopathy.
Case Discussion
MRI features highly suggestive of an aggressive vertebral hemangioma with compressive myelopathy


 Unable to process the form. Check for errors and try again.