
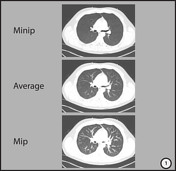


There are multiple ways of processing CT images after the image data has been acquired. The results of perhaps the three most basic ways are shown here: minimum intensity projection images (Minip), average images, and maximum intensity projection images (Mip).
CT slices are made up of pixels arranged along x and y axes. The gray scale value of a pixel (blackness/whiteness) reflects the average attenuation (density, measured in Hounsfield units) of the structure or tissue (e.g. air, bone, blood etc.) represented by the pixel.
Minip, average and Mip images all result from combining multiple thinner slices in a slab into a single summary image. The computer compares the attenuation of pixels at the same x and y locations along the z axis (yellow dashed lines) of those pixels within the same column. The computer then makes another pixel for the combined or summary image based on the attenuation of the pixels at the same x and y positions along the z axis. How it makes those pixels depends on whether a Minip, average, or Mip image is being produced. The resulting pixels are placed into the appropriate x/y positions on the image matrix used to make the summary image.
In a Minip image, the blackest pixels (least attenuation) along a group of pixels within a slab at the same x and y locations along the z axis are used to make the combined image.
In an average image, the pixel attenuation along a group of pixels within a slab at the same x and y locations along the z axis are averaged to make the combined image.
In a Mip image, the whitest pixels (most attenuation) along a group of pixels within a slab at the same x and y locations along the z axis are used to make the combined image.
Minip images are typically used to detect/evaluate mosaic attenuation, such as in this case of air trapping.
But, since Minip images discard the densest pixels, abnormalities like this nodule may be missed with Minip images.
Thick average images have a better signal to noise ratio than thin images. X-rays, like visible light are photons. The more photons you use to make an image, the better the signal to noise. A thick slice is made with more photons than a thin slice, hence the improved signal to noise ratio.
But, if the image is too thick, smaller abnormalities like this fracture may be missed on thick images because of "volume averaging".
Mip images are often used to detect pulmonary nodules. In a thin cross section, a slice through a pulmonary vessel may mimic a nodule: Mip images accentuate the cylindrical nature of vessels, allowing ready distinction from spherical nodules.
But, since low attenuation pixels are discarded in a Mip reconstruction, thrombus in vessles may be missed on Mip images.
Case Discussion
Please see findings.
Original images by Stefan Tigges.


 Unable to process the form. Check for errors and try again.