
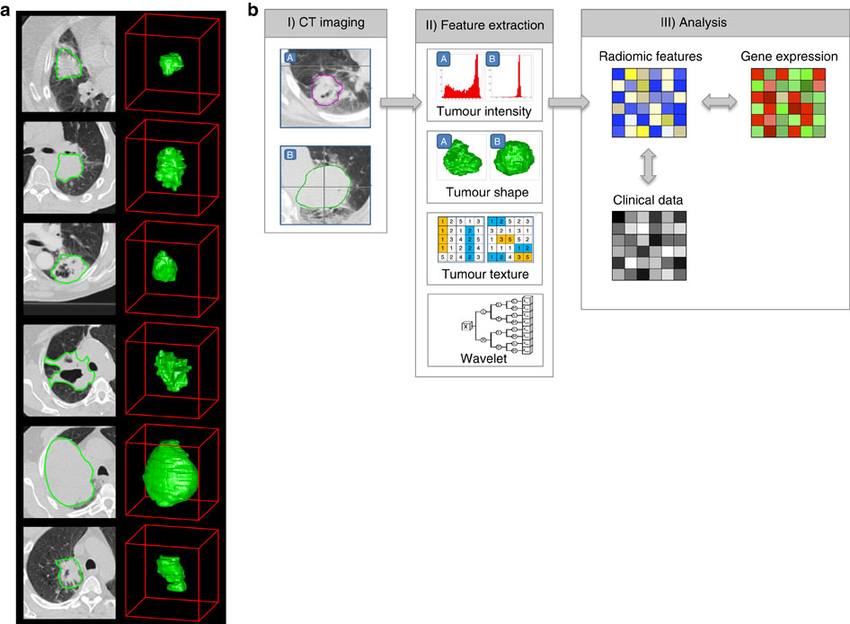
Extracting radiomics data from images. (a) Tumors are different. Example computed tomography (CT) images of lung cancer patients. CT images with tumor contours left, three-dimensional visualizations right. Please note strong phenotypic differences that can be captured with routine CT imaging, such as intratumour heterogeneity and tumor shape. (b) Strategy for extracting radiomics data from images. (I) Experienced physicians contour the tumor areas on all CT slices. (II) Features are extracted from within the defined tumor contours on the CT images, quantifying tumor intensity, shape, texture and wavelet texture. (III) For the analysis the radiomics features are compared with clinical data and gene-expression data.
Case Discussion
Author: Aerts H et al.
Original file: https://www.nature.com/articles/ncomms5006
Modifications: Nil.
License: This file is licensed under Creative Commons Attribution-NonCommercial-NoDerivs 3.0 Unported License.
If you believe your copyright has been infringed, please write to license@radiopaedia.org giving details of why you believe this is so.


 Unable to process the form. Check for errors and try again.