
Presentation
Abdominal pain and distension. Incidental splenic mass by ultrasound
Patient Data
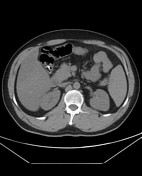

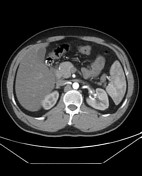
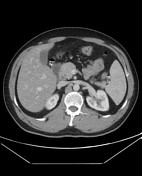
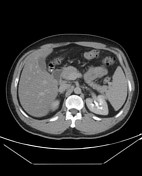

CT study shows a lower splenic pole well defined lobulated mass lesion elicits iso- to hypo- density to in the non-enhanced study. In the post-contrast study, the lesion shows mild progressive enhancement more prominent in the delayed phase where the lesion appears heterogeneous with no complete contrast fill-in

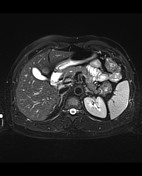
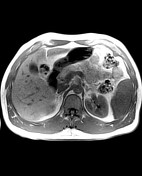
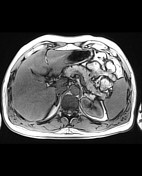

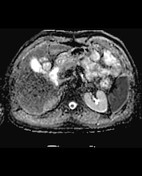
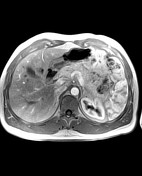
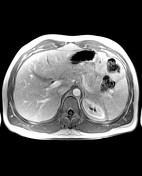
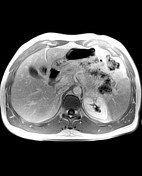
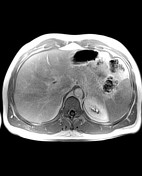
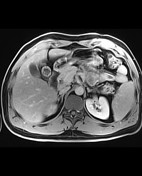
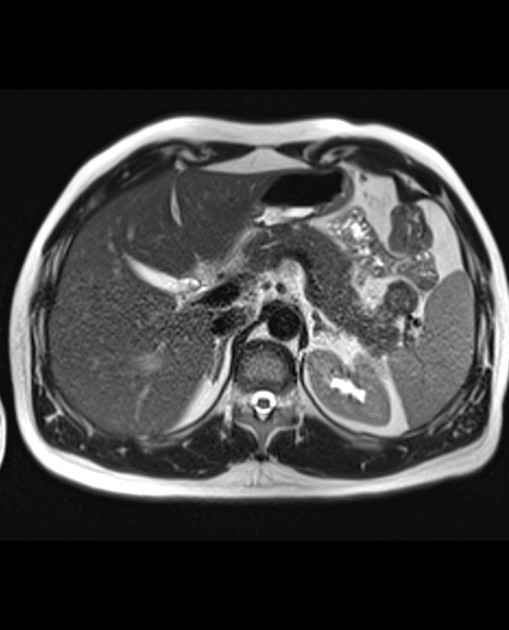
MRI study shows a lower splenic pole well defined lobulated mass lesion. It elicits intermediate signal intensity in T1 with multiple hypointense foci in T1 in-phase likely related to hemosiderin deposition. In T2WI the lesion presents hypointensity. No restriction in the diffusion study
In the dynamic study, the lesion elicits a progressive enhancement pattern that is maximum in the delayed phase with a central non-enhancing scar
Case Discussion
Sclerosing angiomatoid nodular transformation (SANT) of the spleen is an idiopathic non-neoplastic vascular lesion of the spleen that is usually discovered incidentally. It may be a fibrosing variant of splenic hamartoma. Low signal intensity in T2WI is an important differentiating feature from another long list of splenic masses that are usually of high signal in T2WI. It presents a progressive enhancement pattern with a central stellate hypovascular scar. Differential diagnosis is the inflammatory pseudotumor of the spleen that may be also of low signal intensity in T2WI


 Unable to process the form. Check for errors and try again.