
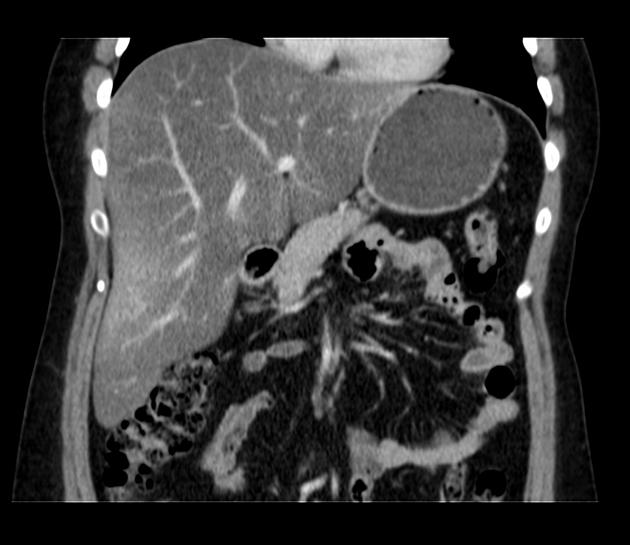
Diffuse hepatic steatosis, also known as fatty liver, is a common imaging finding and can lead to difficulties assessing the liver appearance, especially when associated with focal fatty sparing.
On this page:
Epidemiology
Diffuse hepatic steatosis is common, affecting ~25% of the population.
Pathology
Hepatic steatosis is due to the abnormal accumulation of lipids, particularly triglycerides, within hepatocytes 3,4. These are found in both small and large vesicles. Macroscopically, the liver is enlarged, yellow and greasy. Steatosis can lead to fibrosis and cirrhosis.
Aetiology
Diffuse hepatic steatosis is often idiopathic. However, it may be associated with 1:
alcohol use
-
metabolic dysfunction-associated steatotic liver disease (MASLD) 4, which is associated with
insulin resistance/diabetes mellitus
dyslipidaemia
exogenous steroid intake
drugs: amiodarone, methotrexate, chemotherapy (e.g. tamoxifen)
total parenteral nutrition use
pregnancy: acute fatty liver of pregnancy (AFLP) 4
metabolic disorders: glycogen storage disease, Wilson disease 22
radiation
Radiographic features
General features include:
mild hepatomegaly in ~75% 5
attenuation/signal of liver shifted towards that of fat
-
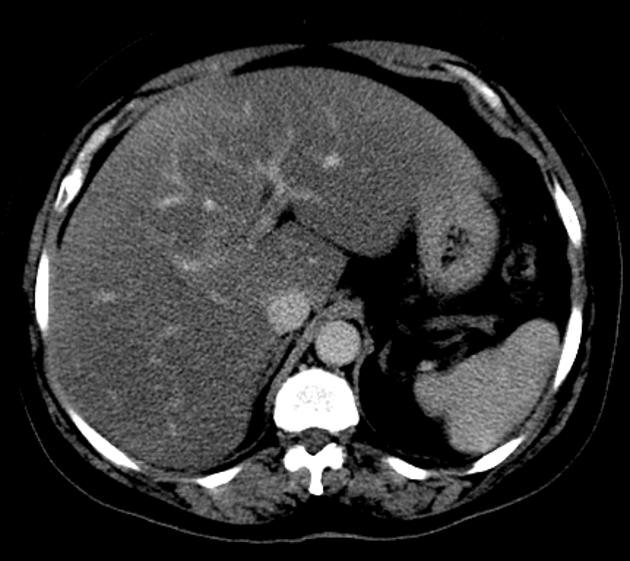
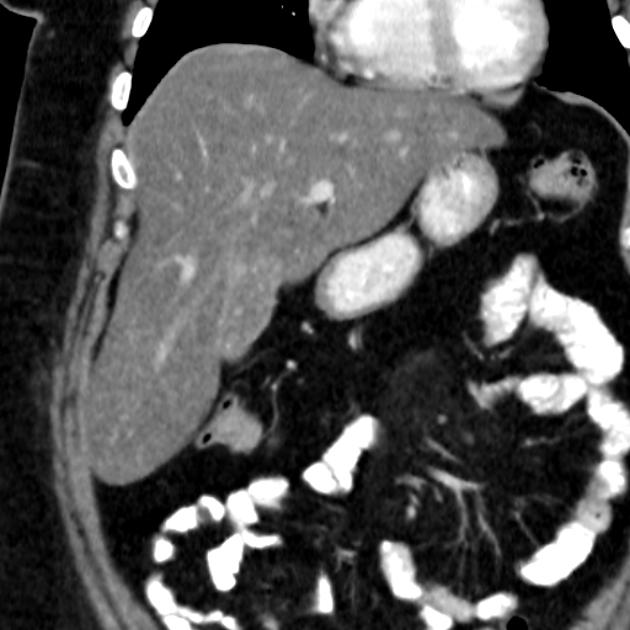
islands of normal liver tissue within a sea of hepatic steatosis
possibly occur due to regional perfusion differences 2
importantly, compared to intrahepatic masses, fatty sparing has no mass effect with no distortion of vessels
see also focal hepatic steatosis
Plain radiograph
Radiolucent liver sign: liver soft-tissue outline becomes difficult to appreciate 5.
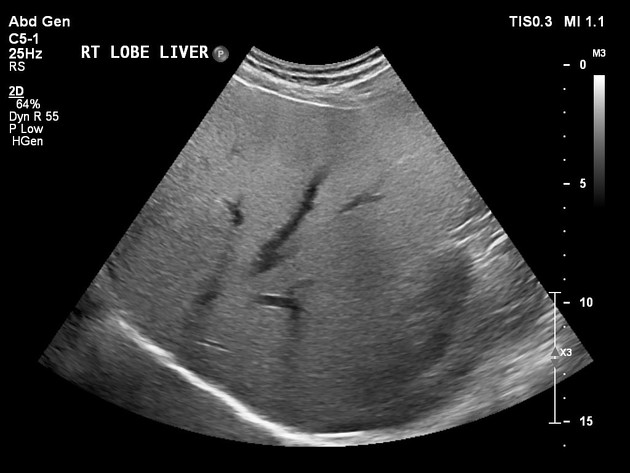
Ultrasound
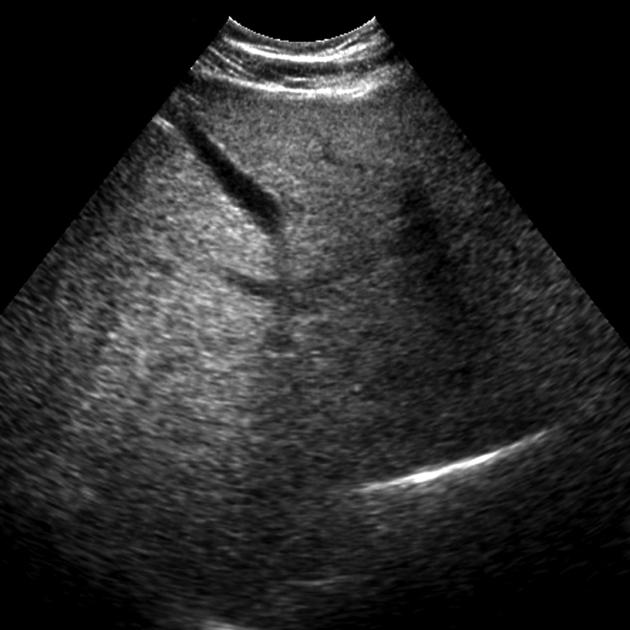
Steatosis manifests as increased echogenicity and beam attenuation 2,12. This results in:
-
renal cortex appearing relatively hypoechoic compared to the liver parenchyma (normally liver and renal cortex are of a similar echogenicity)
increased echogenicity relative to the spleen, when there is parenchymal renal disease
-
absence of the normal echogenic walls of the portal veins and hepatic veins
important not to assess vessels running perpendicular to the beam, as these produce direct reflection and can appear echogenic even in a fatty liver
poor visualisation of deep portions of the liver
poor visualisation of the diaphragm
Sonoelastography (e.g. FibroScan, acoustic radiation force imaging (ARFFI), can assess the degree of accompanying fibrosis by measuring tissue stiffness 10.
Grading
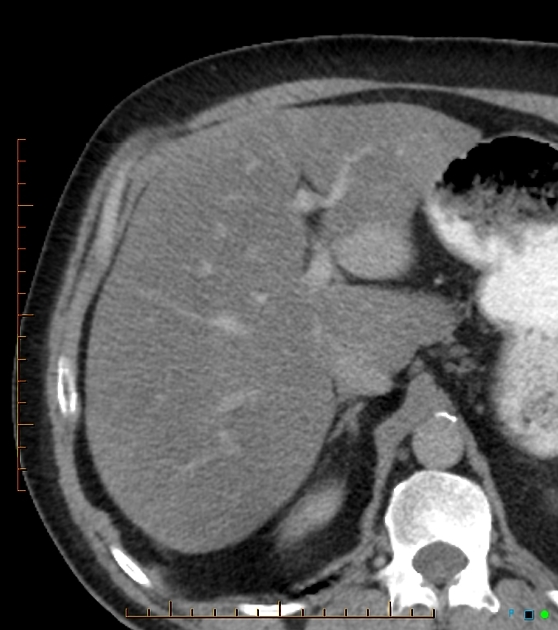
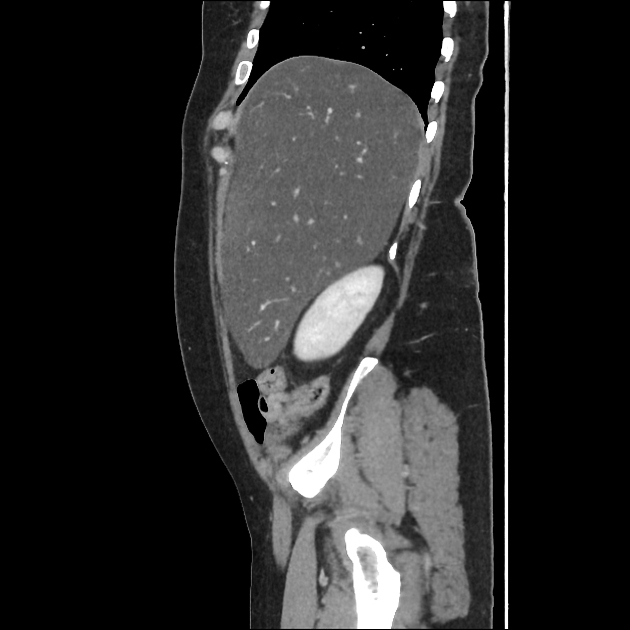
CT
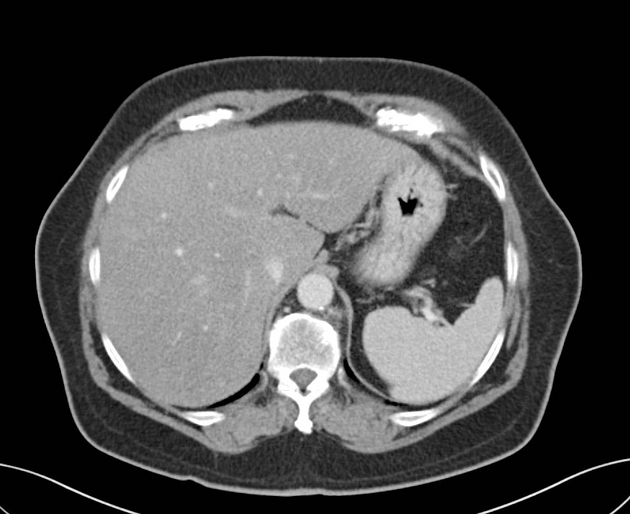
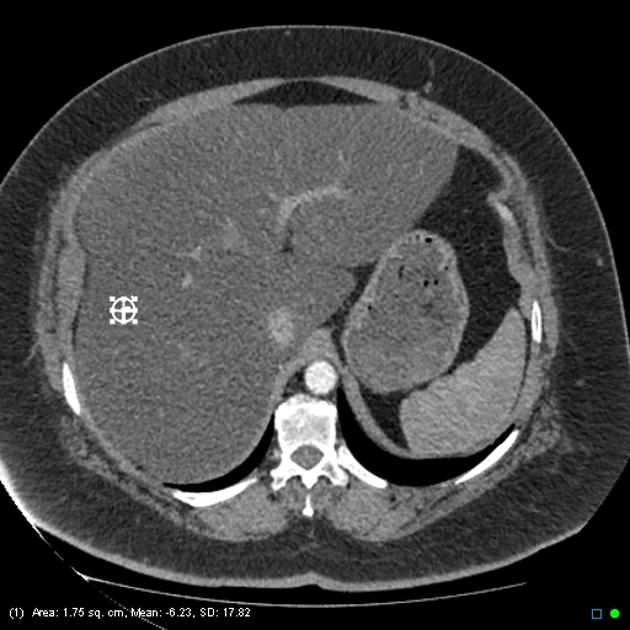
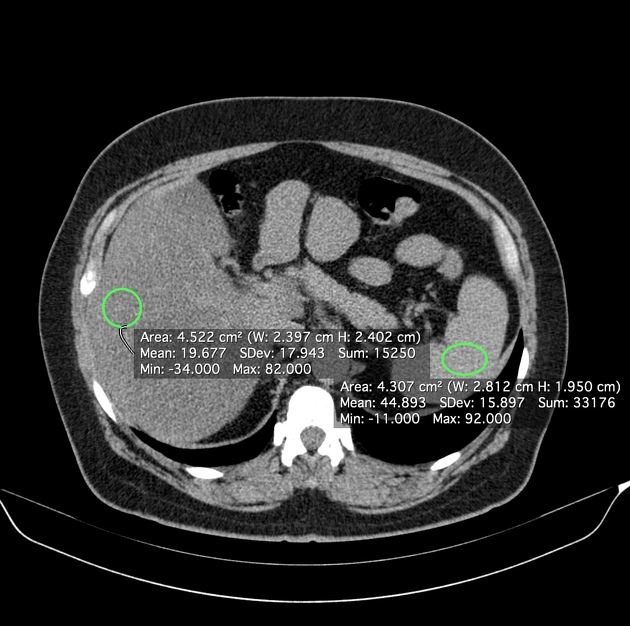
Diffuse steatosis reduces liver attenuation.
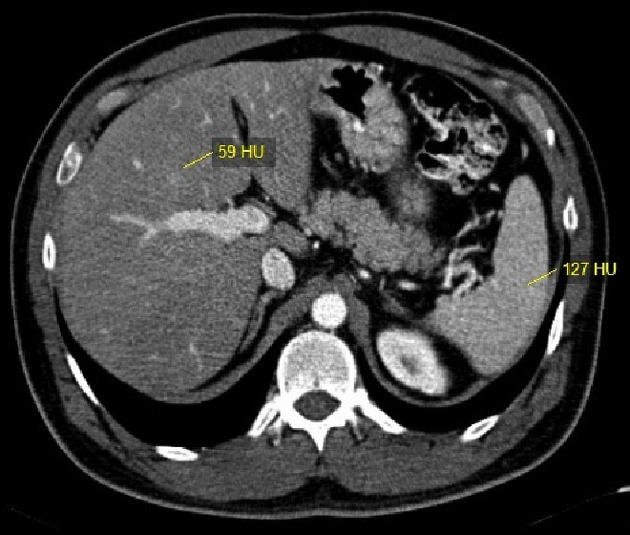
On non-contrast CT, moderate to severe steatosis (at least 30% fat fraction) is predicted by:
relative hypoattenuation: liver attenuation at least 10 HU less than that of spleen 11
absolute low attenuation: liver attenuation lower than 40 HU 15
A subjective grading system has been proposed to describe the degree of hepatic steatosis based on hepatic density and visualisation of hepatic vessels (hepatic veins and portal vein). In this system, grade 5 is when the liver parenchyma is lower attenuation than the unenhanced vessels, and has been associated with hepatic steatosis of at least 30% 23.
In comparison, contrast-enhanced CT is poorly predictive of steatosis due to variation in both hepatic absolute enhancement and relative enhancement compared to spleen depending on contrast administration protocol, scan timing, and patient factors affecting contrast circulation 15. Nevertheless, some criteria for diffuse hepatic steatosis on contrast-enhanced CT have been proposed:
liver-spleen differential attenuation (liver minus spleen) cutoffs ranging from less than -20 to less than -43 HU on portal venous phase, depending on injection protocol 17-19
focal fatty sparing (appearing as qualitatively hyperattenuating geographic regions) along the gallbladder fossa or periphery of segment 4 19
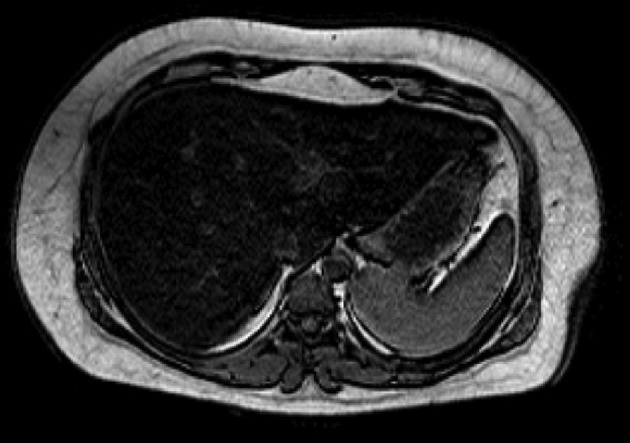
MRI
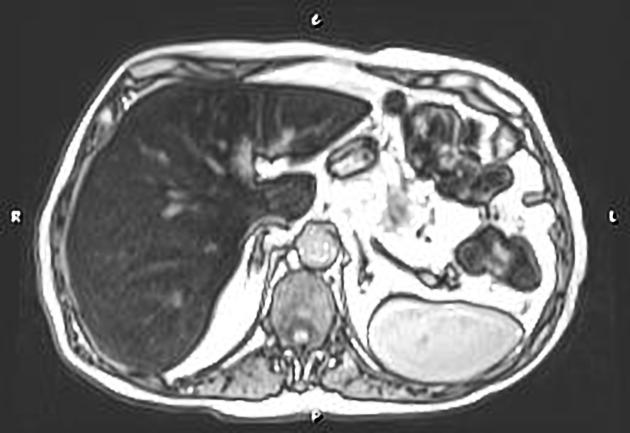
Requires both in-phase (IP) and out-of-phase (OOP) imaging to be adequately assessed 1,16. Fatty liver appears:
T1: hyperintense
T2: mildly hyperintense
IP/OOP imaging: signal drop out on OOP imaging
On IP/OOP imaging, signal loss is demonstrated when there is 10-15% fat fraction with maximum signal loss occurring when there is 50% fatty infiltration of the liver 16. In situations in which there is >50% fatty infiltration, the out-of-phase sequence paradoxically becomes less hypointense than at 50%. This happens because there are relatively fewer water molecules to cancel out the fat signal. Chemical shift artifact at the parenchyma-vessel interface aids in detecting this situation 13. Iron deposition can mask steatosis on IP/OOP imaging 16.
Another method to quantify the grade of steatosis can be made by taking the relative IP and OOP values of the liver and the spleen, using the following formula (percentage of signal intensity loss) 21:
[(Liver IP / Spleen IP) - (Liver OOP / Spleen OOP) ] / [(Liver IP / Spleen IP)] x 100
Where:
liver IP: signal intensity value in a liver ROI (in-phase)
spleen IP: signal intensity value in a spleen ROI (in-phase)
liver OOP: signal intensity value in a liver ROI (out-of-phase)
spleen OOP: signal intensity value in a spleen ROI (out-of-phase)
If PSIL is >10%, the diagnosis of hepatic steatosis can be made 21.
Other MRI uses:
MR spectroscopy: accurate quantitative non-invasive assessment of hepatic steatosis 8
MR elastography: shows promise as a method for assessing accompanying hepatic fibrosis 9
Nuclear medicine
-
Tc-99m sulfur colloid
uptake is reduced in fatty liver 5
reduced hepatic uptake relative to the spleen (reversal of normal liver:spleen uptake ratio)
focal fatty area can simulate a hepatic mass 7
Xe-133: accurate quantitative non-invasive assessment of hepatic steatosis 8
FDG-PET: liver uptake is not altered by the presence of steatosis 6
Treatment and prognosis
As long as hepatic fibrosis and cirrhosis have not developed, fatty change is reversible with modification of the underlying causative factor, e.g. alcohol, pregnancy, obesity, diet.
Practical points
there is potential for missing mild hepatic steatosis on ultrasound if there is concurrent chronic renal disease, which increases the echogenicity of the kidneys; if there is any question that the patient may have a chronic renal disease, comparison of the left kidney with the spleen may be useful
a greater echogenicity difference between the right kidney and the liver than between the left kidney and the spleen is indicative of hepatic steatosis 12
if the attenuation of the liver on unenhanced CT is at least 10 HU less than that of the spleen the diagnosis of fatty liver is made 11
MRI IP/OOP imaging shows a signal drop when fat-fraction >10-15% 16
percentage of signal intensity loss >10% is highly specific for steatosis 21.
External links
If any of these links are broken or for other problems and questions, please contact editors@radiopaedia.org.


 Unable to process the form. Check for errors and try again.