
Computed tomography (CT), also known as, especially in the older literature and textbooks, computerized axial tomography (CAT), is an imaging modality that uses x-rays to build cross-sectional images ("slices") of the body. Cross-sections are reconstructed from measurements of attenuation coefficients of x-ray beams passing through the volume of the object studied.
CT is based on the fundamental principle that the density of the tissue passed by the x-ray beam can be measured from the calculation of the attenuation coefficient. Using this principle, CT allows the reconstruction of the density of the body, by a two-dimensional section perpendicular to the axis of the acquisition system.
On this page:
Acquisition of projection data
The CT x-ray tube (typically with energy levels between 20 and 150 keV), emits N photons (monochromatic) per unit of time. The emitted x-rays form a beam that passes through the layer of biological material of thickness Δx. A detector placed at the exit of the sample, measures N + ΔN photons, ΔN smaller than 0. Attenuation values of the x-ray beam are recorded and the data is used to build a 3D representation of the scanned object/tissue.
There are two processes of absorption: the photoelectric effect and the Compton effect. This phenomenon is represented by a single coefficient, mju.
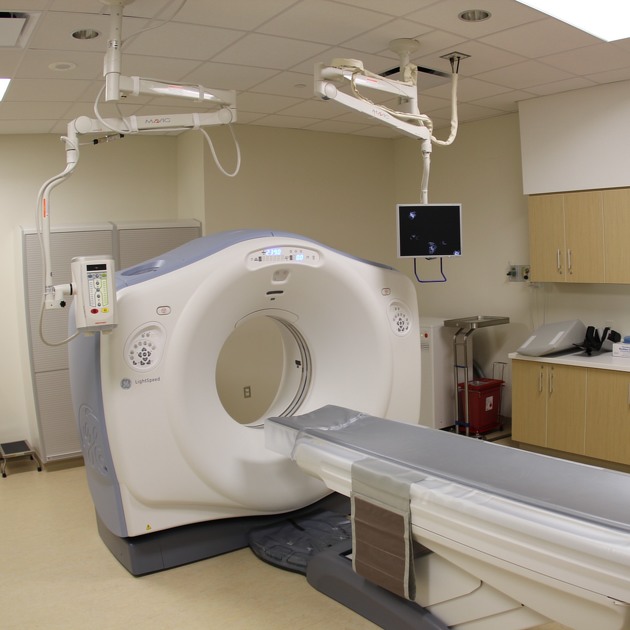
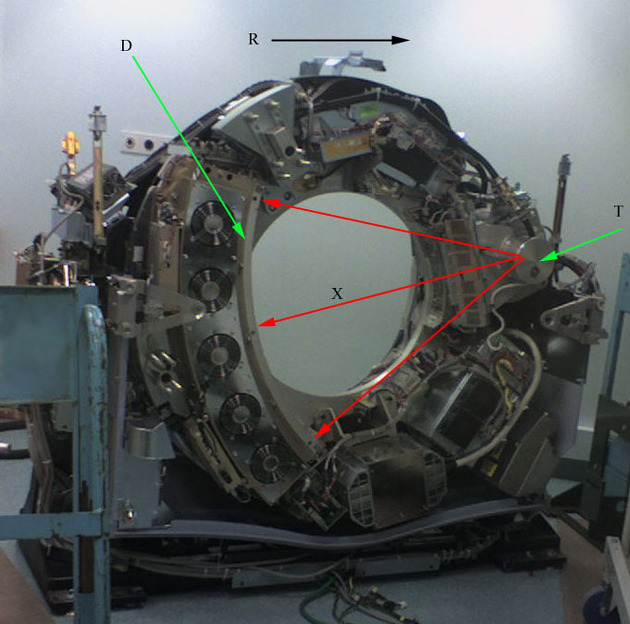
In the particular case of CT, the emitter of x-rays rotates around the patient and the detector, placed on diametrically opposite sides, picks up the image of a body section (beam and detector move in synchrony).
Unlike x-ray radiography, the detectors of the CT scanner do not produce an image. They measure the transmission of a thin beam (1-10 mm) of x-rays through a full CT of the body. The image of that section is taken from different angles, and this allows to retrieve the information on the depth (in the third dimension).
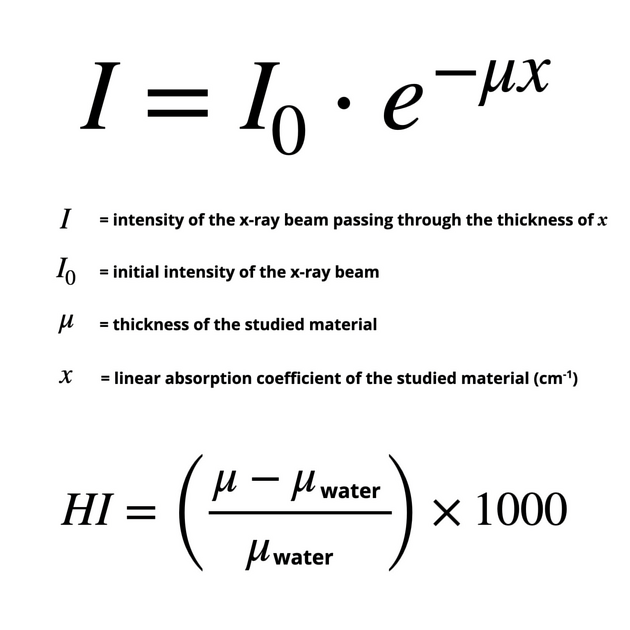
If the x-ray at the exit of the tube is made monochromatic or quasimonochromatic with the proper filter, one can calculate the attenuation coefficient corresponding to the volume of irradiated tissue by the application of the general formula of absorption of the x-rays in the field (see Figure 1).
The outgoing intensity I(x) of the beam of photons measured will depend on the location. I(x) is smaller where the body is more radiopaque.
The CT image is a digital image and consists of a square matrix of elements (pixel), each of which represents a voxel (volume element) of the tissue of the patient.
The typical CT image is composed of 512 rows, each of 512 pixels, i.e., a square matrix of 512 x 512 = 262,144 pixels (one for each voxel). In the processing of the image, the value of the attenuation coefficient for each voxel corresponding to these pixels needs to be calculated.
In conclusion, a measurement made by a detector CT is proportional to the sum of the attenuation coefficients.
Image reconstruction
The CT deals with the attenuation of the x-rays during the passage through the body segment. However, several features distinguish it from conventional radiology: the image is reconstructed from a large number of measurements of attenuation coefficients. It gathers together all the data coming from the elementary volumes of material through the detectors.
To obtain tomographic images of the patient from the "preprocessed" CT dataset, the computer uses complex mathematical algorithms for image reconstruction. Using the computer, it presents the elementary surfaces of the reconstructed image from a projection of the data matrix reconstruction, the tone depending on the attenuation coefficients.
Back projection is the most direct way of recontructing an image. However, each image point is surrounded by a halo-shaped star that degrades the contrast and blurs the boundary of the object. To avoid this, the method of filtered back projection is used. The action of the filter function is such that the negative value created is the filtered projection, when projected backwards, is removed, and an image is produced, which is the accurate representation of the original object.
Before the data are presented on the screen, the conventional rescaling was made into CT numbers, expressed in dimensionless Hounsfield Units (HU), as mentioned above. CT numbers based on measurements with the EMI scanner invented by Sir Godfrey Hounsfield 6, a Nobel prize winner for his work in 1979, related the linear attenuation coefficient of a localized region with the attenuation coefficient of water, the multiplication factor of 1000 is used for CT number integers.
Hounsfield chose a scale that reflects the four basic x-ray densities in the human body, with the following values:
air = -1000 HU (Hounsfield units)
fat = -60 to -120 HU
water = 0 HU
compact bone = +1000 HU
The final image contains CT numbers in each voxel.
Terminology
Although it is common to hear and see the use of the term "CT scan", the addition of the word "scan" is redundant in most use cases. For example, "Mrs JS had a CT scan of her chest" is rendered no less understandable if instead "Mrs JS had a CT of her chest" is used. Indeed the addition of the word scan here is entirely superfluous; in the same tautological vein, stating "MRI scan" is also pointless. Quite clearly "bone scan" is different as the term scan here is being used as a synonym for scintigraphy. "Mrs JS had a bone scan" is unintelligible if "Mrs JS had a bone" replaces it!
However, calling the hardware used to obtain the CT, a CT scanner is acceptable, not least so that a reader understands that the text is referring to the hardware itself and not the digital image outputted. Although, in many cases, the context will mean that, for example, talking about how "we have installed a new CT", means that the word scanner is not always necessary.
History and etymology
The mathematical-physical theoretical principles underlying CT imaging originates from the work of the Austrian mathematician Johann Radon; he demonstrated (1917) the possibility of reconstructing a three-dimensional object through an infinite number of its two-dimensional projections (the Radon trasformation) 7.


 Unable to process the form. Check for errors and try again.